fbpx

Tag Archives: HARMAN

60 Seconds with Steve Johnson of Audix

Steve Johnson
Steve Johnson, vice president of sales and marketing at Audix.

Q: What is your new position, and what does it entail?

A: I recently joined Audix as vice president of sales and marketing. The marketing responsibility is global, but my sales focus is on the United States.

Q: How has your background prepared you for this?

A: My first job for an audio manufacturer was at Shure, where I joined as the product line manager for wireless products in 1993. Since leaving Shure in 2003 as vice president of global marketing, I’ve worked in various marketing and product management capacities across the audio chain—from BSS and dbx signal processing at Harman to Electro-Voice loudspeakers at Bosch. Most recently, I was CEO at Community Professional Loudspeakers, where I had the pleasure of helping recapture the mojo of that American brand. Following Biamp’s acquisition of Community last summer, I decided it was time for a new challenge.

Joining Audix is a welcome return to my microphone roots. The microphone is the critical first link in the audio chain, so failure is not an option. I don’t believe you can “fix it in the mix.” For nearly two decades, the tagline at Audix has been “Performance Is Everything.” At face value, this appears to be simply a product performance message, but I also see it as a promise to the user and installer that it’s their performance that we are committed to capturing, faithfully and accurately.

While professional microphones have long been associated with the stage, studio or house of worship, it is exciting to see the same level of attention now being given to the front end of the audio chain in the corporate world. No amount of DSP will make up for a poor microphone choice. This is true whether on a video conference call in the executive board room or on a Zoom call when sheltering at home. Great audio—which all starts with selecting the right microphone—really does make a difference.

Q: What new marketing initiatives are we likely to see from the company?

A: While many know Audix for our iconic OM Series of handheld vocal microphones and D Series drum microphones, we are also a leading provider of installed microphones in the conferencing space with our M Series. We are competing against some of the giants of the industry, so we look for ways to speak directly and intimately to a broad range of customers across multiple product categories and applications. For this reason, online marketing—including social media—will continue to grow in importance in our marketing mix.

60 Seconds with Jonathan ‘JP’ Parker of Danley Sound Labs

Q: What are your short and long-term goals?

A: In the short term, I want to really understand everything that goes into the design and manufacture of an Audix product, what makes it special. I’m inspired by the level of vertical integration and supply chain control in our factory in Wilsonville, OR. Watching an aluminum rod being transformed on one of our state-of-the-art CNC machines into the housing of a D Series drum is something everyone should experience. Check out “Making of the Audix D6 Drum Microphone” on YouTube!

There is an extraordinary willingness at Audix to invest in U.S.-based manufacturing capability. As the leader of sales and marketing, my long-term goal is to demonstrate the wisdom of these investments by generating significant and profitable sales growth in the United States and beyond.

Q: What is the greatest challenge you face?

A: We launched several new products this year at NAMM, including a line of headphones and earphones. While Audix may be best known as a microphone brand, I believe our “Performance Is Everything” message is just as relevant in the listening category. My challenge will be demonstrating this to be the case. I enjoy a good challenge!

Audix • www.audiusa.com

Hooked on the Science of Sound

This past month, I was interviewed by Bruel & Kjaer’s, “Waves Magazine” in their Expert Profile feature. For those people not familiar with Bruel & Kjaer located in Denmark they are one of the oldest (in operation since 1942) best known manufacturers of acoustic and vibration measurement equipment.
The interviewer was interested in how my career transitioned from musician to recording engineering to acoustic/psychoacoustics. Essentially, my career has been a world-wind trip through the Circle of Confusion where I was guided by my interests, curiosity in the perception and measurement of sound, and the opportunities I was presented at the time. There was no master plan. Hopefully, we’ve helped remove some of the confusion in the circle by providing with a better understanding of what influences the quality of recorded and reproduced sound, and how to make it better and more consistent.
You can read the entire interview here:

TWiRT 337 – Predicting Headphone Sound Quality with Sean Olive

The predicted sound quality of 61 different models of in-ear headphones (blue curve) versus their retail price (green bars).

On February 16, 2017 I was interviewed by host Kirk Harnack on This Week in Radio Tech. The topic was  “Predicting Sound Headphone Sound Quality”. You can find the interview here.

During the interview, Kirk asked if it’s possible to design a good sounding headphones for a reasonable cost. Or does one need to spend a considerable amount of cash to obtain good sound? Fortunately for consumers,   my answer was that you can get decent sound without having to spend thousands or even hundreds of dollars. In fact, there is almost no correlation between price and sound quality based on our research.
 I referred to the slide above that shows the predicted sound quality for 61 different models of in-ear headphones based on their measured frequency response.  The correlation between price and sound quality is close to zero and, slightly negative: r = -.16 (i.e. spending more money gets you slightly worse sound on average).

So, if you think spending a lot of money on in-ear headphones guarantees you will get excellent sound, you may be sadly disappointed. One of the most expensive IE models ($3000) in the above graph, had a underwhelming predicted score of 20-25% depending what EQ setting you chose. The highest scoring headphone was a $100 model that we equalized to hit the Harman target response, which our research has shown to be preferred by the majority of listeners.

The sound quality scores in the graph are predicted using a model based on a small sample of headphones that were evaluated by trained listeners in double-blind test. The accuracy of the model is better than 96% but limited to the small sample we tested.  We just completed a large listening test study involving over 30 models and 75 listeners that will allow us to build more accurate and robust predictive models. 
The ultimate goal of this research is to accurately predict the sound quality of headphones based on acoustic measurements without having to conduct expensive and time consuming listening tests. The current engineering approach to tuning headphones is clearly not optimal based on the above slide. Will headphone industry standards, headphone manufacturers and audio review magazines use similar predictive models to reveal to consumers how good the headphones sound?  What do you think?

A Virtual Headphone Listening Test Method

Fig. 1 The Harman Headphone Virtualizer App allows listeners to make double-blind comparisons of  different headphones through a high-quality replicator headphone. The  app has two listening modes: a sighted mode (shown) and a blind mode (not shown) where listeners are not biased by non-auditory factors (brand, price, celebrity endorsement,etc). Clicking on the picture will show a larger version.

Early on in our headphone research  we realized there was a need to develop a listening test method that allowed us to conduct more controlled double-blind listening tests on different headphones.  This was necessary in order to remove tactile cues (headphone weight and clamping force), visual and psychological biases  (e.g. headphone brand, price, celebrity endorsement,etc )  from listeners’ sound quality judgements of headphones.  While these factors (apart from clamping force) don’t physically affect the sound of headphones, our  previous research [1]  into blind vs. sighted listening tests revealed their cognitive influence affects listeners’  loudspeaker preferences [1], often in adverse ways. In sighted tests,  listeners were also less sensitive and  discriminating compared to blind conditions when judging different loudspeakers including their interaction with different music selections and loudspeaker positions in the room. For that reason, consumers should be dubious of loudspeaker and headphone reviews that are based solely on sighted listening.
While blind loudspeakers listening tests are possible through the addition of an acoustically-transparent- visually-opaque-curtain,  there is no simple way to hide the identity of a headphone when the listener is wearing it.  In our first headphone listening tests,  the experimenter positionally substituted the different headphones onto the listener’s head from behind so that the headphone could not be visually identified. However, after a couple of trials, listeners began to identify certain headphones simply by their weight and clamping force. One of the easiest headphones for listeners to identify was the Audeze LCD-2, which was considerably heavier (522 grams) and more uncomfortable than the other headphones. The test was essentially no longer blind.
To that end, a virtual headphone method was developed whereby listeners could A/B different models of headphones that were virtualized through a single pair of headphones (the replicator headphone). Details on the method and its validation were presented at the 51st Audio Engineering Society International Conference on Loudspeakers and Headphones [2] in Helsinki, Finland in 2013.  A PDF of the slide presentation can be found  here.
Headphone virtualization is done by measuring the frequency response of the different  headphones at the DRP (eardrum reference point) using a G.R.A.S. 45 AG, and then equalizing the replicator headphone to match the measured responses of the real headphones.  In this way, listeners can make instantaneous  A/B comparisons between any number of virtualized headphones through the same headphone without the visual and tactile clues biasing their judgment. More details about the method are in the slides and AES preprint.
An important questions is: “How accurate are the virtual headphones compared to the actual headphones”?  In terms of their linear acoustic performance they are quite similar. Fig. 2 compares the  measured frequency response of the actual versus virtualized headphones.  The agreement is quite good up to 8-10 kHz above which we didn’t aggressively equalize the headphones because of measurement errors and large variations related to headphone positioning both on the coupler and the listeners’ head.
Fig. 2 Frequency response measurements of the6  actual versus virtualized headphones made on a  GRAS 45 AG coupler with pinna. The dotted curves are based on the physical headphone and the solid curves are from the virtual (replicator) headphone.  The measurements of the right channel of the headphone (red curves) have been offset by 10 dB from the left channels (blue curve) for visual clarify. Clicking on the picture will show a larger version.

More importantly, “Do the actual and virtual headphones sound similar”? To answer this question we performed a validation experiment where listeners evaluated 6 different headphone using both standard and virtual listening methods Listeners gave both preference and spectral balance ratings in both standard and virtual tests. For headphone preference ratings the correlation between standard and virtual test results was r = 0.85. A correlation of 1 would be perfect but 85% agreement is not bad, and hopefully more accurate than headphone ratings based on sighted evaluations. 
The differences between virtual and standard test results we believe are in part due to nuisance variables that were not perfectly controlled across the two test methods. A significant nuisance variable would likely be headphone leakage that would affect the amount of bass heard depending on the fit of the headphone on the individual listener. This would have affected the results in the standard test but not the virtual one where we used an open-back headphone that largely eliminates leakage variations across listeners.  Headphone weight and tactile cues were present in the standard test but not the virtual test, and this could in part explain the differences in results.  If these two variables could be better controlled even higher accuracy can be achieved in virtual headphone listening.

Fig.3 The mean listener preference ratings and 95% confidence intervals shown for the headphones rated using the Standard and Virtual Listening Test Methods. The Standard Method listeners evaluated the actual headphones with tactile/weigh biases and any leakage effects. In the Virtual Tests, there were no visual or tactile cues about the headphones. Note: Clicking on the picture will show a larger version.

Some additional benefits from virtual headphone testing were discovered besides eliminating sighted and psychological biases: the listening tests are faster, more efficient and more sensitive. When listeners can quickly switch and compare all of the headphones in a single trial, auditory memory is less of a factor, and they are better able to discriminate among the choices. Since this paper was written in 2013, we’ve improved the accuracy of the virtualization in part by developing a custom pinnae for our GRAS 45 CA that better simulates the leakage effects of headphones measured on real human subjects [3].
Finally, it’s important to acknowledge what the virtual headphone method doesn’t capture: 1)  non-minimum phase effects (mostly occurring at higher frequencies) and 2)  non-linear distortions that are level-dependent. The effect of these two variables on virtual headphone test method have been recently tested experimentally and will be the topic of a future blog posting. Stay tuned. 
References
[1] Floyd Toole and Sean Olive,”Hearing is Believing vs. Believing is Hearing: Blind vs. Sighted Listening Tests, and Other Interesting Things,” presented at the 97th AES Convention, preprint 3894 (1994). Download here.

[2] Sean E. 

[3] Todd Welti, “Improved Measurement of Leakage Effects for Circum-Aural and Supra-Aural Headphones,” presented at the 38th AES Convention, (May 2014). Download here.

The Influence of Listeners’ Experience, Age and Culture on Headphone Sound Quality Preferences

At the recent 137th convention of the Audio Engineering Society we presented our latest research paper entitled, “The Influence of Listeners’ Experience, Age and Culture on Headphone Sound Quality Preferences.

The paper describes some double-blind  headphone listening tests conducted in four different countries (Canada, USA, China and Germany) involving 238 listeners of different ages, gender and listening experiences. Listeners gave comparative preference ratings for three popular headphones and a new reference headphone that were virtually presented through a common replicator headphone equalized to match their measured frequency responses. In this way, biases related to headphone brand, price, visual appearance and comfort were removed from listeners’ judgment of sound quality. On average, listeners preferred the reference headphone that was based on the in-room frequency response of an accurate loudspeaker calibrated in a reference listening room. This was generally true regardless of the listener’s experience, age, gender and culture. This new evidence suggests a headphone standard based on this new target response would satisfy the tastes of most listeners. 

The paper is available for download from the AES e-library. You can also find a PDF of our presentation here or view the presentation on YouTube.


My Article on Headphone Sound Quality in 2014 LIS

The 2014 Loudspeaker Industry Sourcebook came out this week. In it, you can find an article I wrote called “Perceiving and Measuring Headphone Sound Quality: Do Listeners Agree on What Makes a Headphone Sound Good?”

The article is a summary of some recent published research we’ve conducted at Harman on the perception and measurement of headphone sound quality.

Together, these studies provide scientific evidence that when headphone brand, price, fashion, and celebrity endorsement are removed subjective evaluations, listeners generally agree on what makes a headphone sound good.

So far, this has been true regardless of users’ listening training, age, or culture.  The more preferred headphones tend to have a smooth, extended frequency response that approximates an accurate loudspeaker’s in-room response. This new target frequency response could provide the basis for a new and improved headphone target response. You can find more details on the research here.

The Relationship between Perception and Measurement of Headphone Sound Quality

Above: The brands and models of six popular headphones used in this study.

In many ways, our scientific understanding of the perception and measurement of headphone sound quality is 30  years behind our knowledge of loudspeakers. Over the past three decades, loudspeaker scientists have developed controlled listening test methods that provide accurate and reliable measures of   listeners’ loudspeaker preferences, and their underlying sound quality attributes.  From the perceptual data, a set of acoustical loudspeaker measurements has been identified from which we can model and predict listeners’ loudspeaker preference ratings with about 86% accuracy.
In contrast to loudspeakers, headphone research is still in its infancy. Looking at published acoustical measurements of  headphones you will discover there is little consensus among brands (or even within the same brand) on how a headphone should sound and measure [1]. There exists too few published studies based on controlled headphone listening tests to identify which objective measurements and target response curves produce an optimal sound quality. Controlled, double-blind comparative  subjective evaluations of different headphones present significant logistical challenges to the researcher that include controlling headphone tactile and visual biases. Sighted biases related to price, brand, and cosmetics have been shown to significantly bias listeners judgements of loudspeaker sound quality. Therefore, these nuisance variables must be controlled in order to obtain accurate assessments of headphone sound quality.

Todd Welti and I recently conducted a study to explore the relationship between the perception and measurement of headphone sound quality. The results were presented at the 133rd AES Convention in San Francisco,  in October 2012.  A PDF of the slide presentation referred to below can be found here. The AES preprint can be found in the AES E-library. The results of this study are summarized below.

Measuring The Perceived Sound Quality of Headphones

Double-blind comparative listening tests were performed on six popular circumaural headphones ranging in price from $200 to $1000 (see above slide).  The listening tests were carefully designed to minimize biases from known listening test nuisance variables (slides 7-13). A panel of 10 trained listeners rated each headphone based on overall preferred sound quality, perceived spectral balance, and comfort. The listeners also gave comments on the perceived timbral, spatial, dynamic attributes of the headphones to help explain their underlying sound quality preferences.

The headphones were compared four at a time over three listening sessions (slide 12).  Assessments were made using three music programs with one repeat to establish the reliability of the listeners’ ratings.  The  order of headphone presentations, programs and listening sessions were randomized to minimize learning and order-related biases. The test administrator manually substituted the different headphones on the listener from behind so they were not aware of the headphone brand, model or appearance during the test  (slide 8).  However, tactile/comfort differences were part of the test.  Listeners could adjust the position of the headphones on their heads via light weight plastic handles attached to the headphones.

Listeners Prefer Headphones With An Accurate, Neutral Spectral Balance

When the listening test results were statistically analyzed, the main effect on the preference rating was  due to the different headphones (slide 15).  The  preferred headphone models were perceived as having the most neutral, even spectral balance (slide 19) with the less preferred models having too much or too little energy in the bass, midrange or treble regions.  Frequency analysis of listeners’ comments confirmed listeners’ spectral balance ratings of the headphones, and proved to be a good predictor of overall preference (slide 20). The most preferred headphones were frequently described as “good spectral balance, neutral with low coloration, and good bass extension,” whereas the less preferred models were frequently described as “dull, colored, boomy, and lacking midrange”.

Looking at the individual listener preferences, we found good agreement among listeners in terms of which models they liked and disliked (slides 16 and 18). Some of the most commercially successful models were among the least preferred headphones in terms of sound quality. In cases where an individual listener had poor agreement with the overall listening panel’s headphone preferences, we found either the listener didn’t understand the task (they were less trained),  or the headphone didn’t properly fit the listener, thus causing air leaks and poor bass response; this was later confirmed by doing in-ear measurements of the headphone(s) on individual listeners (slides 26-39).

Measuring the Acoustical Performance of Headphones

Acoustical measurements were made on each headphone using a GRAS 43AG Ear and Cheek simulator equipped with an IEC 711 coupler (slide 24). The measurement device is intended to simulate the acoustical effects of an average human ear including the acoustical interactions between the headphone and the acoustical impedance of the ear.  The headphone measurements shown below include these interactions as well as the transfer function of the ear, mostly visible in the graphs as a ~10 dB peak at around 3 kHz.  It is important to note that we since we are born with these ear canal resonances, we have adapted to them and don’t “hear” them as colorations.

Relationship between Subjective and Objective Measurements 

Comparing the acoustical measurements of the headphones to their perceived spectral balance confirms that the more preferred headphones generally have a smooth and extended response below 1 kHz that is perceived as an ideal spectral balance (slide 25). The least preferred headphones  (HP5 and HP6)   have the most uneven measured and perceived frequency responses below 1 kHz, which generated listener comments such as “colored, boomy and muffled.”  The measured frequency response of HP4 shows a slight bass boost below 200 Hz, yet on average it was perceived as sounding thin; this headphone was one of the models that had bass leakage problems for some listeners due to a poor seal on their ears.

Above: The left and right channel frequency response measurements of each headphone are shown above the  mean preference rating and 95% confidence interval it received in blind listening tests. The dotted green response on each graph shows the “perceived spectral balance” based on the listeners’ responses.

Conclusions

In conclusion, this headphone study is one of the first of its kind to report results based on controlled, double-blind listening tests [2]. The results provide evidence that trained listeners preferred the headphones perceived to have the most neutral, spectral balance. The acoustical measurements of the headphone generally confirmed and predicted which headphones listeners preferred. We also found that bass leakage related to the quality of fit and seal of the headphone to the listeners’  head/ears can be a significant nuisance variable in subjective and objective measurements of headphone sound quality.

It is important for the reader not to draw generalizations from these results beyond the conditions we tested. One audio writer has already questioned whether headphone sound quality preferences of trained listeners can be extrapolated to tastes of untrained younger demographics whose apparent appetite for bass-heavy headphones might indicate otherwise. We don’t know the answer to this question. For younger consumers, headphone purchases may be  driven more by fashion trends and marketing B.S. (Before Science) than sound quality.  While this question is the focus of future research, the preliminary data suggests  in blind A/B comparisons kids pref headphones with accurate reproduction to colored, bass-heavy alternatives.  This would tend to confirm findings from previous investigations into loudspeaker preferences of high school and college students (both Japanese and American) that so far indicates most listeners prefer accurate  sound reproduction regardless of age, listener training or culture.

Future headphone research may tell us (or not) that most people prefer accurate sound reproduction regardless of whether the loudspeakers are installed in the living room, the automobile, or strapped onto the sides of their head.  It makes perfect sense, at least to me. Only then will listeners hear the truth —  music reproduced as the artist intended.
________________________________

Footnotes
[1] Despite the paucity of good subjective measurements on headphones there does exist some online resources where you can find objective measurements on headphones. You will be hard pressed to find a manufacturer who will supply these measurements of their products. The resources include Headroom.com, Sound & Vision Magazine, and InnerFidelity.com.  Tyll Hertsens at InnerFidelity  has a large database of frequency response measurements of headphones that clearly illustrate the lack of consensus among manufacturers on how a headphone should sound and measure. There is even a lack of consistency among different models made by the same brand.

[2]  Sadly, studies like this present one are so uncommon in our industry that Sound and Vision Magazine  recently declared this paper as the biggest audio story in 2012. Hopefully that will change sooner than later.

Harman Science of Sound Demonstrations at Rocky Mountain Audio Fest 2011

October 14-16, I will be  giving Science of Sound presentations for the Harman Luxury Audio Group (room #8020)   at the Rocky Mountain Audio Fest (RMAF) in Denver, CO. My demonstration will be repeated every 1/2 hour on the hour and half-hour.

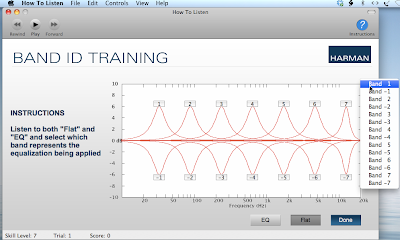
Drop by and find out more about the science behind Harman audio product development and testing including JBL and Revel loudspeakers. I will be demonstrating our latest release of the “How to Listen”  software used for training and selecting listeners for product research and testing. Find out how discriminating and reliable you are as a critical listener.

Attendees will be given 30% discount coupons towards a copy of Floyd Toole’s book “Sound Reproduction” (Focal Press), a book that describes much of the current scientific knowledge and perception of  the sound quality of loudspeakers, listening rooms, and their acoustical interaction with each other.  I will be raffling off a few copies to the best performing listeners.

I hope to see you there!

Harman’s “How to Listen” Listener Training Software Now Available as Beta

Well, it’s been some time coming, but the listener training software Harman How to Listen is finally available for free download here. This beta software is available in both Mac OSX and Windows versions.

We are pleased to offer the software packaged with four high quality music samples, courtesy of Bravura Records. The 24-bit music tracks are provided in both 96 kHz and 48 kHz formats in order to be compatible with older PC sound cards. We hope you try the software, and find that it improves you critical listening skills. This is a work in progress, and we expect to add more features and training tasks to this public version of the software over time. Enjoy!

Select your currency